Benchmark HPS-integrated DLRM
Benchmark Setup
We create the DLRM model with native TensorFlow and its counterpart with HPS Plugin for TensorFlow using the create_tf_models.py script. The DLRM model with native TF is in the SavedModel format and the size is about 16GB, which is almost the size of embedding weights because the size of dense layer weights is small. The DLRM model with the plugin leverages HPS to store the embedding table and perform embedding lookup. The JSON configuration file and the embedding table file required by HPS are also generated by the script.
Furthermore, we build HPS-integrated TensorRT engines for the DLRM model using the create_trt_engines.py script, in both fp32 and fp16 modes. The workflow can be summarized as three steps: convert TF SavedModel to ONNX, perform ONNX graph surgery to insert HPS plugin layer and build the HPS-integrated TensorRT engines.
We compare three deployment methods on the Triton Inference Server:
DLRM with Native TensorFlow: The experimental option VariablePolicy.SAVE_VARIABLE_DEVICES is used to enable the CPU and GPU hybrid deployment of the DLRM SavedModel, i.e., the embedding table is on CPU while the MLP layers are on GPU. This deployment method is common for native TF models with large embedding tables and can be regarded as the baseline of this benchmark. The deployment is on the Triton backend for TensorFlow.
DLRM with HPS Plugin for TensorFlow: In this DLRM SavedModel,
tf.nn.embedding_lookupis replaced byhps.LookupLayerto perform embedding lookup and the MLP layers are kept unchanged. The deployment is on the Triton backend for TensorFlow.DLRM with HPS Plugin for TensorRT: The HPS plugin layer is integrated into the built TensorRT engines, and the MLP layers are accelerated by TensorRT. The TensorRT engines are built with mininum batch size 1, optimum 1024 and maximum 131072. Both fp32 and fp16 modes are investigated. The deployment is on the Triton backend for TensorRT.
The benchmark is conducted on the A100-SXM4-80GB GPU with one Triton model instance on it. The GPU embedding cache of HPS is turned on and the cache percentage is configured as 0.2. For details about how to deploy HPS-integrated TF models and TRT engines on Triton, please refer to hps_tensorflow_triton_deployment_demo.ipynb and demo_for_tf_trained_model.ipynb.
After launching the Triton Inference Server, we send the same batch of inference data repeatedly using Triton Performance Analyzer. In this case, the embedding lookup is served by the GPU embedding cache of HPS and the best-case performance of HPS can be studied. The command and the sample data to measure the latency for batch size 1 can be found below:
perf_analyzer -m ${MODEL_NAME} -u localhost:8000 --input-data 1.json --shape categorical_features:1,26 --shape numerical_features:1,13
{
"data":[
{
"categorical_features":[276633,7912898,7946796,7963854,7971191,7991237,7991368,7998351,7999728,8014930,13554004,14136456,14382203,14382219,14384425,14395091,14395194,14395215,14396165,14671338,22562171,25307802,32394527,32697105,32709007,32709104],
"numerical_features":[3.76171875,3.806640625,1.609375,4.04296875,1.7919921875,1.0986328125,1.0986328125,1.609375,2.9453125,1.0986328125,1.38671875,8.3984375,1.9462890625]
}
]
}
We take the forward latency at the server side as our benchmark metric, which is reported by the performance analyzer via the compute infer field:
  Server:
    Inference count: 28589
    Execution count: 28589
    Successful request count: 28589
    Avg request latency: 562 usec (overhead 9 usec + queue 9 usec + compute input 59 usec + compute infer 431 usec + compute output 53 usec)
Results
The benchmark is conducted with the Merlin TensorFlow container nvcr.io/nvidia/merlin/merlin-tensorflow:23.02 on a machine with A100-SXM4-80GB + 2 x AMD EPYC 7742 64-Core Processor. The software versions are listed below:
TensorFlow version: 2.10.0
Triton version: 22.11
TensorRT version: 8.5.1-1+cuda11.8
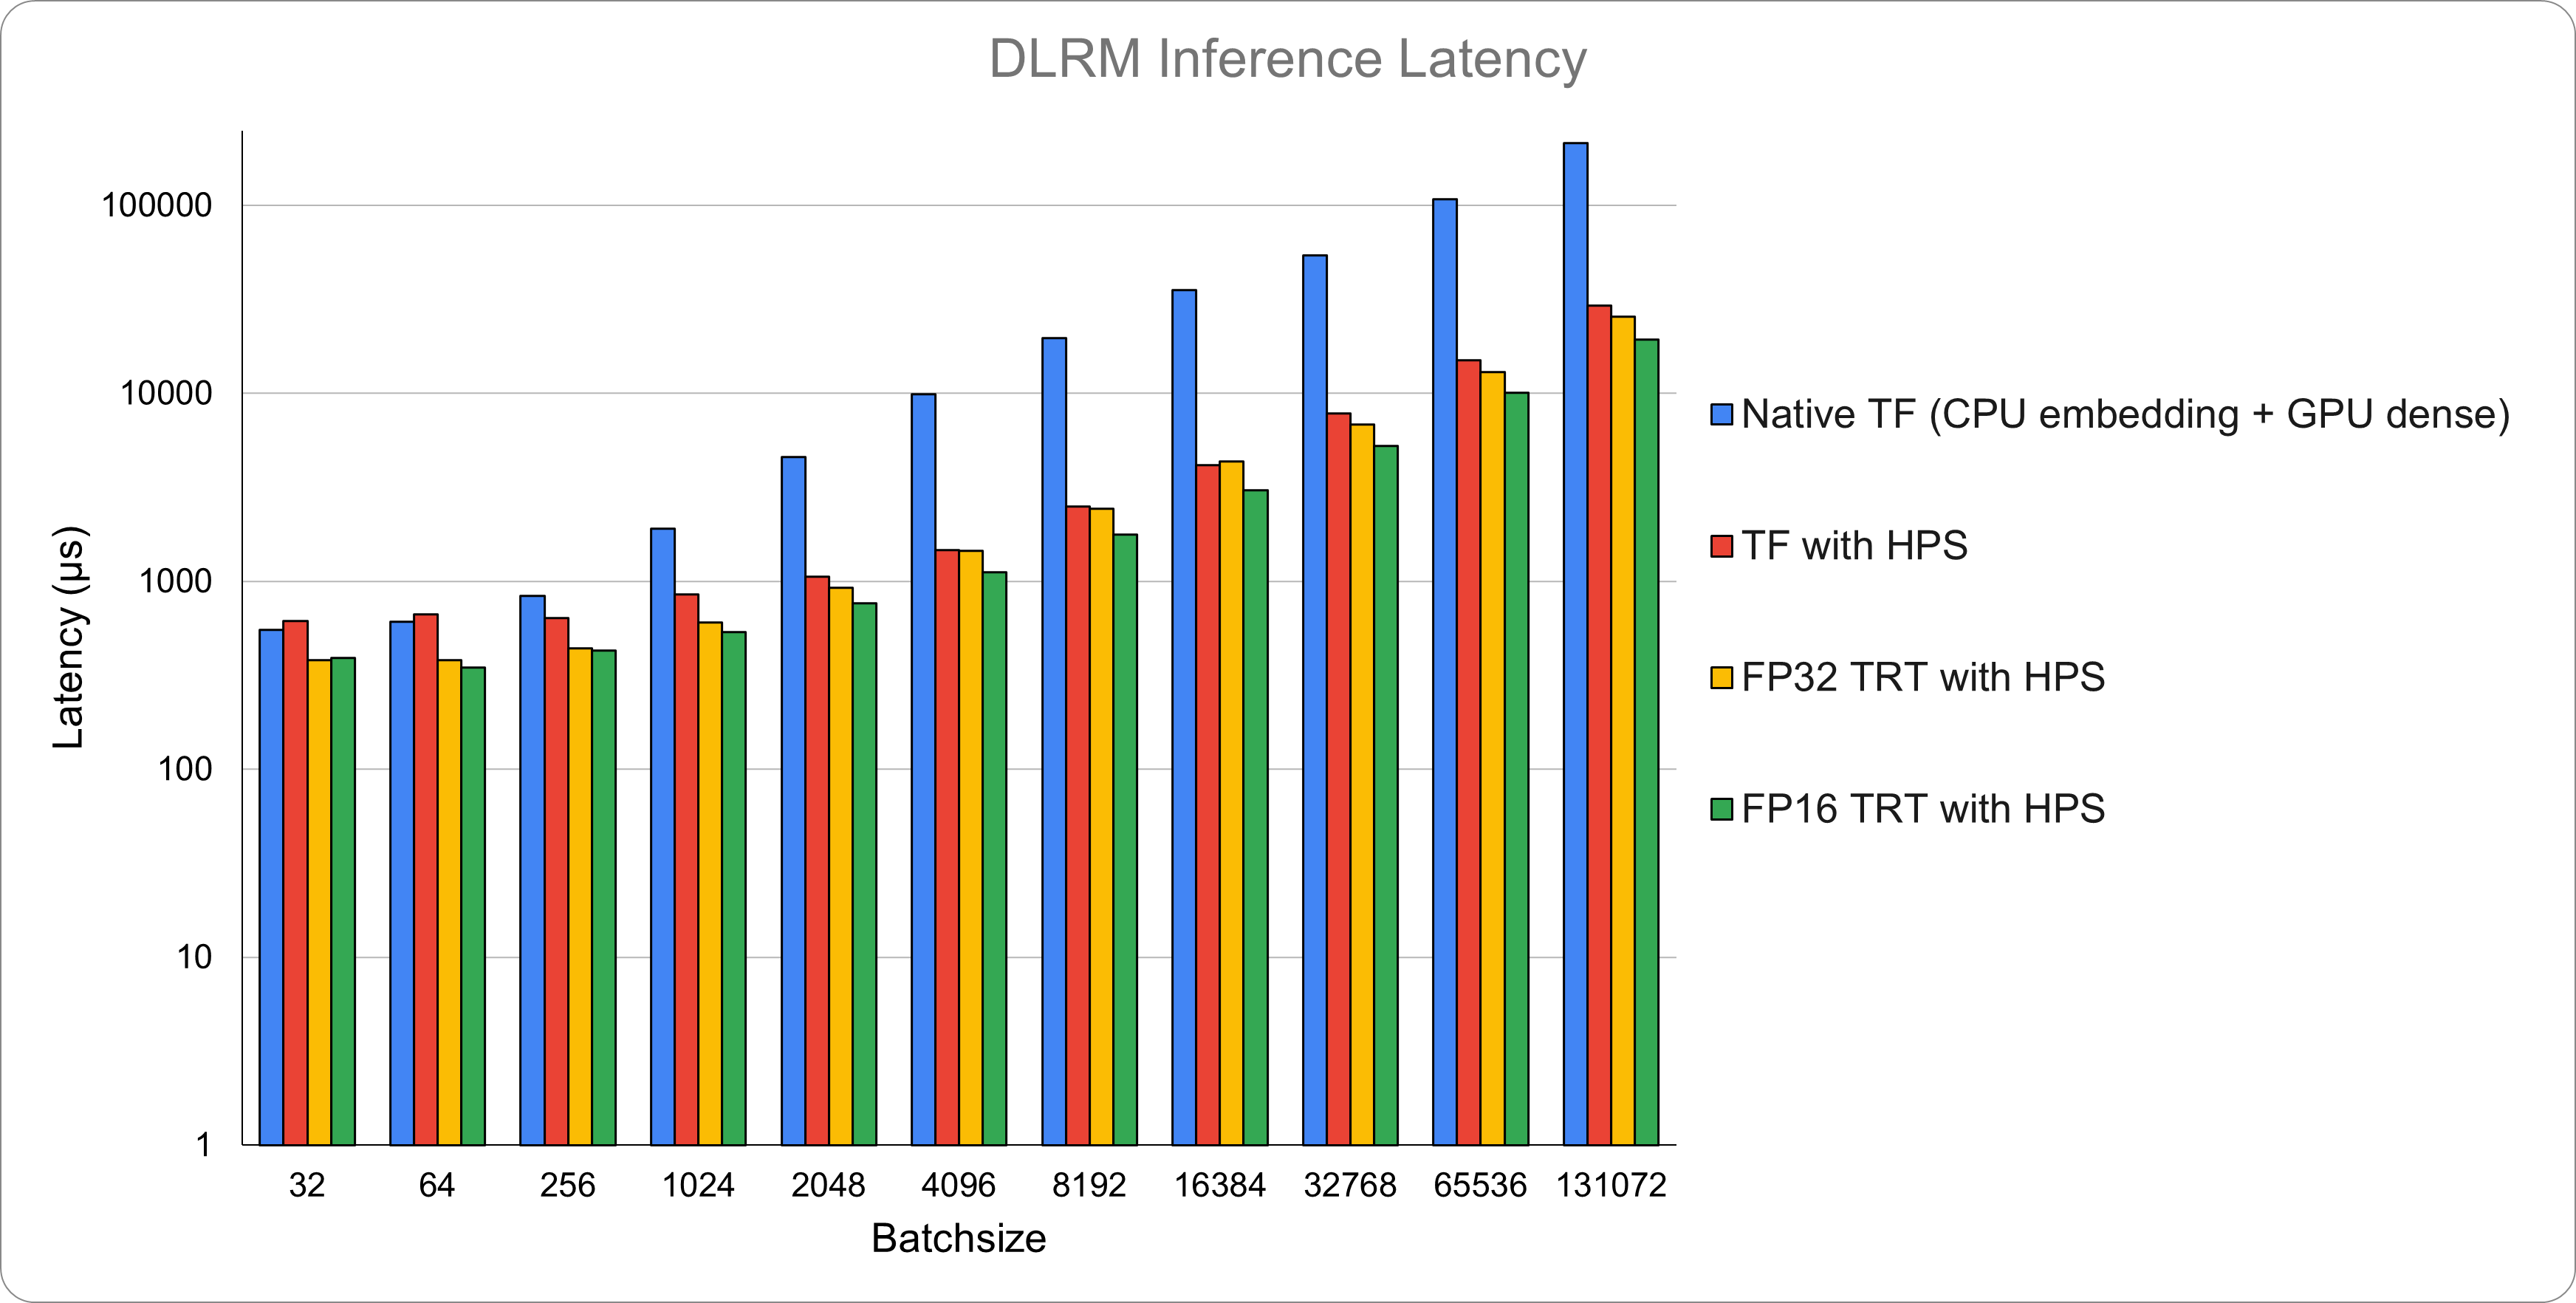
The per-batch forward latency, in milliseconds, measured at the server side is shown in the following table and Figure 1. The Y-axis is logarithmic. The FP16 TRT engine with HPS achieves the best performance on almost all batch sizes, and has about 10x speedup to the Native TF baseline on large batch sizes.
Batch size |
Native TF |
TF with HPS |
FP32 TRT with HPS |
FP16 TRT with HPS |
Speedup - FP16 TRT with HPS to Native TF |
|---|---|---|---|---|---|
32 |
551 |
612 |
380 |
389 |
1.42 |
64 |
608 |
667 |
381 |
346 |
1.76 |
256 |
832 |
639 |
438 |
428 |
1.94 |
1024 |
1911 |
849 |
604 |
534 |
3.58 |
2048 |
4580 |
1059 |
927 |
766 |
5.98 |
4096 |
9872 |
1459 |
1446 |
1114 |
8.86 |
8192 |
19643 |
2490 |
2432 |
1767 |
11.12 |
16384 |
35292 |
4131 |
4355 |
3053 |
11.56 |
32768 |
54090 |
7795 |
6816 |
5247 |
10.31 |
65536 |
107742 |
15036 |
13012 |
10022 |
10.75 |
131072 |
213990 |
29374 |
25440 |
19340 |
11.06 |